| Oracle® Database 2 Day + Performance Tuning Guide 11g Release 1 (11.1) Part Number B28275-01 |
|
|
View PDF |
| Oracle® Database 2 Day + Performance Tuning Guide 11g Release 1 (11.1) Part Number B28275-01 |
|
|
View PDF |
Oracle Database includes a built-in alerts infrastructure to notify you of impending problems with the database. By default, Oracle Database enables the following alerts:
Tablespace Usage
Snapshot Too Old
Recovery Area Low on Free Space
Resumable Session Suspended
For information about alerts and how to manage them, see Oracle Database 2 Day DBA.
In addition to these default alerts, you can use performance alerts to detect any unusual changes in database performance.
This chapter contains the following sections:
A metric is defined as the rate of change in some cumulative statistic. This rate can be measured against a variety of units, including time, transactions, or database calls. For example, the number database calls per second is a metric.
Performance alerts are based on metrics that are performance-related. These alerts are either environment-dependent or application-dependent.
Environment-dependent performance alerts may not be relevant on all systems. For example, the AVERAGE_FILE_READ_TIME metric generates an alert when the average time to read a file exceeds the metric threshold. This alert may be useful on a system with only one disk. On a system with multiple disks, however, the alert may not be relevant because I/O processing is spread across the entire subsystem.
Application-dependent performance alerts are typically relevant on all systems. For example, the BLOCKED_USERS metric generates a performance alert when the number of users blocked by a particular session exceeds the metric threshold. This alert is relevant regardless of how the environment is configured.
To obtain the most relevant information from performance alerts, set the threshold values of performance metrics to values that represent desirable boundaries for your system. You can then fine-tune these values over time until an equilibrium is reached.
To set thresholds for performance metrics:
On the Database Home page, under Related Links, click Metric and Policy Settings.
The Metric and Policy Settings page appears, showing the Metric Thresholds subpage.
For each performance metric relevant for your system, click the Edit icon.
The Edit Advanced Settings page appears.
Follow the steps of the wizard to set the threshold value.
See Also:
Oracle Database 2 Day DBA to learn how to set metric thresholds
When an alert is generated by Oracle Database, it appears under Alerts on the Database Home page.

Oracle Enterprise Manager enables you to configure alerts to be sent by means of e-mail, pager, or cellular phone text messaging.
To respond to an alert:
On the Database Home page, under Alerts, locate the alert that you want to investigate and click the Message link.
A page that contains further information about the alert appears.
Do one of the following:
Follow the recommendations.
Run Automatic Database Diagnostic Monitor (ADDM) or another advisor to get more detailed diagnostics of the system or object behavior.
See Also:
Oracle Database 2 Day DBA for information about how to configure the alert notification method
Most alerts, such as the CPU Utilization alert, are cleared automatically when the cause of the problem disappears. However, other alerts, such as the Generic Alert Log Error alert, must be acknowledged.
After taking the necessary corrective measures, you can acknowledge an alert by clearing or purging it. Clearing an alert sends the alert to the Alert History, which can be viewed from the Database Home page under Related Links. Purging an alert removes it from the Alert History.
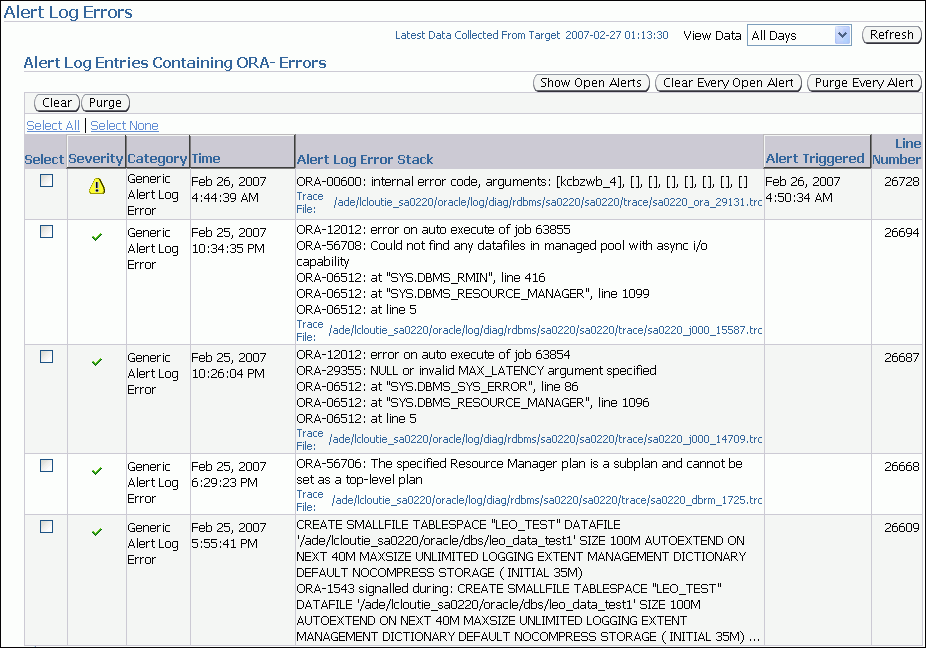
On the Database Home page, under Diagnostic Summary, click the Alert Log link.
The Alert Log Errors page appears.

Do one of the following:
Select the alerts that you want to clear and click Clear.
To clear all open alerts, click Clear Every Open Alert.
Do one of the following:
Select the alerts that you want to purge and click Purge.
To purge all alerts, click Purge Every Alert.
See Also:
Oracle Database 2 Day DBA to learn how to manage alerts